
ABSTRACT
This study presents detailed fingerprinting studies to characterize blue sapphire from the Baw Mar deposit in the Mogok Stone Tract, Myanmar. These sapphires typically range from 2 to 8 mm, with some reaching up to 15 cm in length. The gem-quality blue sapphires studied often exhibited distinct pleochroism, ranging from greenish blue to violet blue, and were relatively inclusion-free. In some of the samples, microscopic observations revealed multiple twinning planes associated with tiny whitish needle-like inclusions such as boehmite. Unlike sapphires from other Mogok locations, needle-like rutile inclusions were rare in the Baw Mar samples. A critical new observation from this study was the presence of ilmenite silk needles aligned in three distinct directions, or “three-directional ilmenite silk,” which may indicate a unique crystallization environment or exsolution mechanism distinct from other sapphire localities. Microscopic observations, combined with spectroscopic and chemical analysis, can be used to distinguish Baw Mar blue sapphires from those found in other localities including different Mogok locations. The trace element variations of Baw Maw sapphires appear to result from magmatic heterogeneity, possibly related to melt evolution, fractional crystallization, or minor interaction with metasomatic fluids within the intrusive host rocks. The observed geochemical signatures in Baw Mar sapphires are best explained by formation in a magmatic system, likely linked to syenitic pegmatite intrusions, with internal chemical variability rather than metamorphic overprinting. Laser ablation–inductively coupled plasma–mass spectrometry and uranium-lead dating of a single zircon inclusion in one sapphire sample suggests that the timing of sapphire formation in the Baw Mar area ranged between 54 and 65 million years ago.
Sapphires, particularly blue sapphires, have long held a prominent place in the global gemstone market and continue to attract strong demand and sustained consumer interest. Their enduring appeal is driven by their aesthetic qualities, durability, cultural significance, and close association with historically important gem-producing regions.
In Myanmar, sapphire occurs in both primary deposits (in syenitic pegmatite) and secondary placer deposits (locally called byon) along the Mogok Stone Tract, also known as the Mogok Valley. This is one of the most recognized gem fields in the world, renowned for ruby, sapphire, spinel, peridot, and extremely rare minerals such as johachidolite and painite (Thu, 2007; Zaw, 2017). The Mogok Stone Tract is set in the misty and picturesque mountainous region of northern Myanmar. In recent years, several studies have been conducted on sapphire from different regions of Mogok (e.g., Phyu, 2009; Kan-Nyunt et al., 2013; Soonthorntantikul et al., 2017; Chen et al., 2021; Phyu et al., 2021). Sapphires from Mogok are prized for their extraordinary color and remarkable clarity. The Baw Mar deposit has been of particular interest due to the discovery of high-quality sapphires with intense blue color and exceptional clarity (Kan-Nyunt et al., 2013).
Baw Mar is located northwest of Kyatpyin village, west of Mogok Township, and 17 km from Mogok (22°55'39.9" N, 96°24'43" E). The deposit is comprised of Baw Mar North and Baw Mar South. The area is surrounded by diverse mountains, shaping it into a basin. The Baw Mar primary deposit lies in the mountain range known locally as the “Koe Wun Tin.” Due to its elevation of about 1200 m above sea level, the locality has a relatively cool climate. Subtropical conditions, with an average rainfall of about 200–250 cm annually, result in highly weathered outcrops along the hillsides where mining operations are conducted.
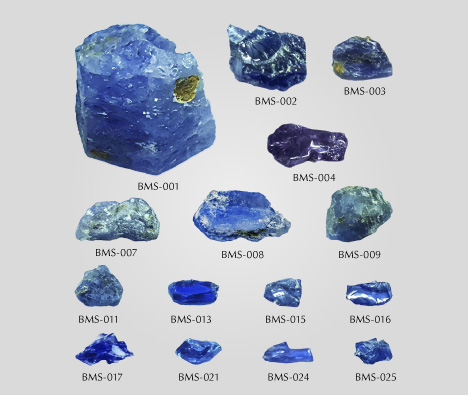
Previous reports have described the Baw Mar mine, the mining techniques employed, and preliminary gemological observations of the sapphires recovered (Kan-Nyunt et al., 2013; Soonthorntantikul et al., 2017). The present article reinforces the existing understanding of this material from previous studies with a combination of standard gemological and microscopic observations with analytical methods, including laser ablation–inductively coupled plasma–mass spectrometry (LA-ICP-MS), Raman spectroscopy, Fourier-transfer infrared (FTIR) spectroscopy, ultraviolet/visible/near-infrared (UV-Vis-NIR) spectroscopy, and scanning electron microscopy equipped with energy-dispersive spectrometry (SEM-EDS) and an automated material identification and classification system (AMICS). The study seeks to refine the characterization of Baw Mar sapphires (figure 1) and establish a preliminary framework for interpreting their origin and timeframe for formation, contributing to a comprehensive genetic and geochronological model.
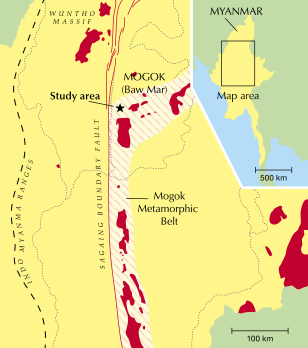
Regional Geology. Geotectonically, the Baw Mar area lies within the Mogok Metamorphic Belt (MMB) (figure 2), which spans in age from the Jurassic to the Miocene and contains numerous primary and secondary ruby and sapphire deposits (Barley et al., 2003; Zaw et al., 2015; Searle et al., 2017; Zaw, 2017; Crow et al., 2023). The MMB is characterized by a sequence of magmatic and metasedimentary rocks exhibiting a wide range of metamorphic grades, from low to high grades, culminating in the upper amphibolite-granulite facies. The dominant unit is banded gneiss (with biotite, garnet, sillimanite, and oligoclase), interspersed with quartzite and bands and lenses of marble (Zaw et al., 2015; Thu and Zaw, 2017; Sutherland et al., 2019; Searle et al., 2020; Lamont et al., 2021). Marbles are major host rocks for the highest quality “pigeon’s blood” ruby, together with spinel, forsterite, diopside, phlogopite, and graphite. The metamorphic rocks are associated with alkaline rocks (mostly sodic nepheline syenite and syenitic pegmatite), which host exceptionally high-quality royal blue sapphires.
Searle et al. (2020) identified the syenite intrusion host rocks as charnockite-syenite and recorded a wide age range, from Jurassic (170–168 Ma) to late Cretaceous to early Paleocene (~68–63 Ma) and late Eocene–Oligocene (44–21 Ma) for syenite samples. Min (2016) reported a uranium-lead zircon age of 57.81 ± 0.5 Ma (Lower Paleocene) for the sapphire-bearing nepheline syenite in the Ondan area, 40 km west of the Mogok area. The Mogok metamorphic and syenitic rocks are accompanied by a mafic-ultramafic suite of peridotite, minor gabbro, and norite with unknown ages (Min, 2016). Post-collisional biotite granites near Mogok at Kabaing yielded a uranium-lead zircon age of 19 Ma (Zaw et al., 2015; Searle et al., 2020).
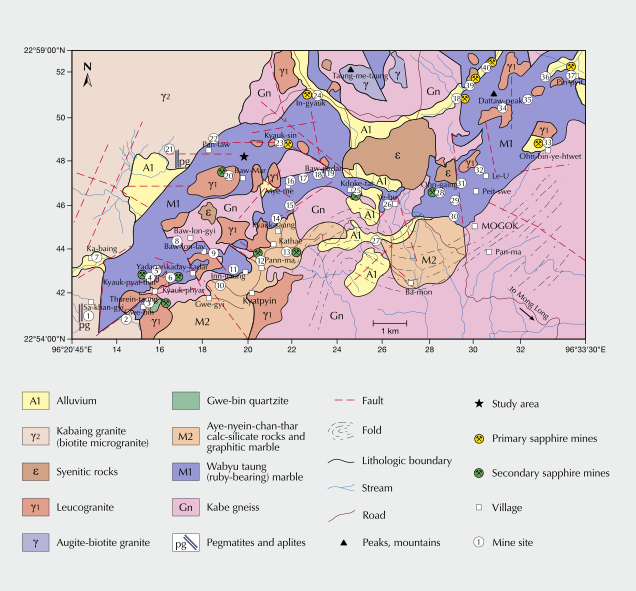
Local Geology. The geological formations in the Baw Mar area comprise metamorphic units including gneiss, calc-silicate, and marble, which have been penetrated by dikes and small intrusions of granitic and syenitic composition (Thu, 2007; Thu and Zaw, 2017; Chen et al., 2021) (figure 3). Granitic rocks include leucogranite and biotite microgranite. The outcrops are limited in extent and poorly exposed. Leucogranite occurs as small pockets associated with sapphire-bearing nepheline syenite and syenitic pegmatite.
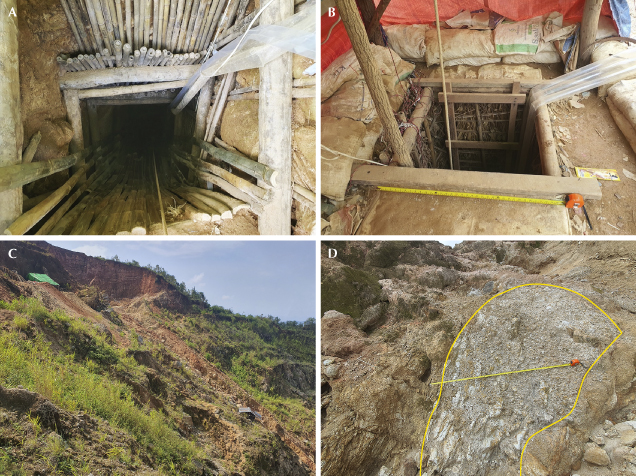
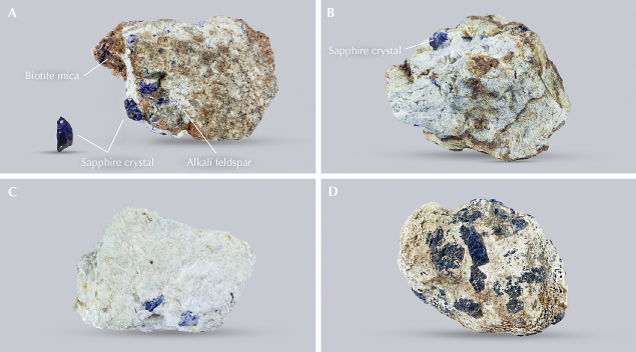
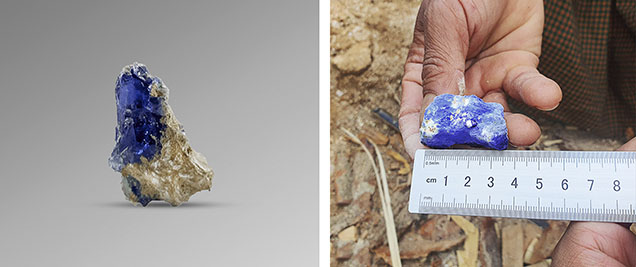
Most of the workings consist of small, gently sloping shafts (al-ter) and vertical shafts (lay-bin-twin or le bin) that measure 1.5 × 1.5 m and up to 30 m deep (figure 4, A and B). Non-sapphire-bearing leucogranite dikes and granitic pegmatite veins intruded weathered gneiss, visible at ground level in exposed rock surfaces (figure 4, C and D). The recently mined area also shows exposed leucogranite in contact with syenite boulders. High-quality blue sapphire is retrieved from this syenite (figure 5, A and B), which, like the pegmatite, has intruded weathered gneiss, as well as from pockets formed at the exposed leucogranite. These sapphires are embedded in clay lenses (feldspar altered to kaolinite) and surrounded by biotite mica and chlorite (figure 5, C and D). They are intimately associated with syenite and are often up to 4 cm in size (figure 6).
Most exposures in the Baw Mar area are highly weathered. The main igneous unit consists of biotite microgranite, which intruded biotite-garnet gneisses and their related rocks. Granitic pegmatites formed small dikes and veins at the margins of the biotite microgranite and the surrounding metamorphic rocks. Some nepheline syenites formed dikes that intruded marble and skarn zones, and these can be found at the contact between igneous intrusions and marble in the Baw Mar area.
MATERIALS AND METHODS
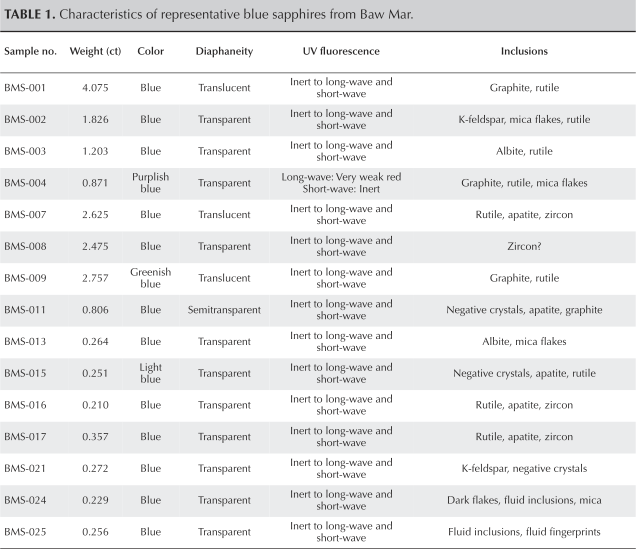
Samples. For this investigation, a total of 200 sapphires were collected by author AMM from primary deposits at small mines in the Baw Mar area during two field trips in June 2023 and January 2024. Of these, 85 samples (BMS-001 to BMS-045 and BMS-080 to BMS-120) were selected for standard gemological testing and microscopic observation of internal features based on size and diaphaneity (ranging from transparent to translucent). The size, color, and transparency of representative sapphire samples are listed in table 1 (again, see figure 1). Twenty samples (BMS-001 to BMS-015, BMS-023 to BMS-026, and BMS-093) were selected, based on uniformity of color and clarity, for UV-Vis-NIR spectroscopy.
Standard Gemological Testing. Gemological properties of the 85 samples, including refractive index (RI), specific gravity (SG), and UV fluorescence, were determined using standard gemological equipment. A gemological microscope was used to study their internal features.
Spectroscopy. Raman microspectrometry analysis was performed at the Gem and Jewelry Institute of Thailand (GIT) in Bangkok for the identification of inclusions using a Renishaw inVia confocal Raman microscope and a Dilor Super LabRam spectrometer equipped with a holographic notch filter, gratings of 600 and 1800 lines/mm, and a liquid nitrogen-cooled CCD detector (with a resolution of 2000 × 450 pixels). Each analysis consisted of a 30 s single accumulation with the sample excited by a 5 mW 514 nm Spectra-Physics 2017 argon-ion laser.
UV-Vis-NIR polarized spectra were collected at GIT using a Cary 5000 spectrophotometer in the 200–800 nm range with a scan speed of 600 nm/min. The 20 selected samples were prepared into wafers with polished surfaces oriented perpendicular to the c-axis. The optical path lengths ranged from 1.230 to 4.551 mm and were measured using a Mitutoyo 395-371-32 spherical micrometer (1-inch range, spherical anvil and spindle).
Mineral Identification. At the University of Tasmania’s Central Science Laboratory (Sandy Bay, Australia), an FEI MLA650 scanning electron microscope (SEM) with a tungsten source was used to identify the host, associated minerals, and mineral inclusions in nine sapphires (BMS-007, BMS-012, BMS-013, BMS-014, BMS-016, BMS-019, BMS-025, BMS-039, and BMS-099). The samples were mounted in epoxy resin, polished, and coated with a 20 nm layer of carbon. The SEM was equipped with a Bruker Quantax Esprit 1.9.4 energy-dispersive X-ray spectrometry (EDS) system and two XFlash 5030 silicon drift detectors with 133 eV energy resolution. Analytical conditions included an accelerating voltage of 20 kV and a beam current of approximately 7 nA, yielding a total EDS X-ray intensity of around 600,000 cps and a dead time of ~30% on quartz. Data was acquired and processed using Bruker’s Automated Material Identification and Classification System (AMICS) software, version 3.0.0.249. Backscattered electron (BSE) imaging contrast and brightness were adjusted on gold metal and epoxy. The Particle Mapping method was used with 512 × 512 pixel imaging resolution, 1.536 mm field of view, and ~4 s acquisition time per frame (corresponding to a pixel size of 3 × 3 μm2). In addition, a Gatan PanaCL-F detector on the same SEM instrument was used to acquire a cathodoluminescence (CL) image of a single zircon inclusion. This zircon inclusion was later analyzed by LA-ICP-MS and subjected to uranium-lead dating.
Trace Element Analysis and Geochronological Dating. Trace element analyses (ppm to ppb levels) of 10 samples (BMS-001, BMS-003, BMS-007, BMS-009, BMS-014, BMS-023, BMS-024, BMS-025, BMS-028, and BMS-093) were conducted using LA-ICP-MS at GIT. The system paired an iCAP RQ ICP-MS with an NWR-213 LA device operating at a wavelength of 213 nm. The laser conditions included a 55 μm diameter laser spot size, a fluence of ~10 J/cm2, and a repetition rate of 10 Hz. Three spots were analyzed for each sample. The ICP-MS was operated at a forward power of ~1550 W, with a typical helium carrier gas flow of 0.75 L/min and an argon plasma gas flow of 14 L/min. Calibration was performed using NIST 612 and NIST 610 glasses as external standards and aluminum as the internal standard. Total acquisition time was 120 s: 30 s of laser warm-up, 60 s of ablation time, and 30 s of washout, with a 0.03 s integration time. Masses for the following isotopes were measured: 9Be, 24Mg, 47Ti, 51V, 53Cr, 57Fe, and 69Ga.
Sapphire sample BMS-019, which contained the single zircon inclusion (identified by SEM-AMICS), was further analyzed at the Center for Ore Deposit and Earth Sciences (CODES), University of Tasmania. This analysis used an ASI RESOlution S-155 ablation system with a Coherent COMPexPro 110 argon-fluorine excimer laser (193 nm wavelength and 20 ns pulse width), coupled to an Agilent 7900 quadrupole ICP-MS. Details of additional analytical conditions are described in Thompson et al. (2018).
Each analysis on the zircon began with a blank gas measurement, followed by 30 s of analysis time once the laser was switched on. Ten laser spots were ablated using a 30 μm spot diameter, a 5 Hz repetition rate, and an energy density of ~2 J/cm2. Ablation was performed in a helium atmosphere with a flow rate of 0.35 L/min. The ablated particles and helium gas were mixed with argon gas flowing at 1.05 L/min and nitrogen gas at 2.5 mL/min, respectively, before being carried to the plasma torch. The following isotopes were measured: 31P, 49Ti, 56Fe, 89Y, 91Zr, 93Nb, 139La, 140Ce, 141Pr, 146Nd, 147Sm, 153Eu, 157Gd, 159Tb, 163Dy, 165Ho, 166Er, 169Tm, 172Yb, 175Lu, 178Hf, 181Ta, 204Pb, 206Pb, 207Pb, 208Pb, 232Th, and 238U. Each isotope was measured every 0.25 s except for the lead isotopes, which were measured with a longer counting time of 0.75 s.
Data reduction was performed using LADR software (Halpin et al., 2014; Norris and Danyushevsky, 2018). For each analysis, a subset was selected for quantification. Corrections for downhole fractionation, instrument drift, and mass bias for lead-to-uranium ratios were calculated using zircon 91500, a commonly used reference material for uranium-lead chronology (Wiedenbeck et al., 1995). Instrument drift and mass bias correction factors for the 207Pb/206Pb ratio were calculated using the lead isotopic values of NIST 610 glass (Baker et al., 2004). Trace element abundances in the zircon were calibrated using NIST 610 glass (Jochum et al., 2011), with 91Zr as the internal standard element and assuming stoichiometric proportions for zircon. The zircon 91500 and the NIST 610 glass calibration standards were analyzed in duplicate at the beginning, end, and every 60 minutes throughout the analytical session.
The calibration of the uranium-lead ages was validated using two standards: the Temora-2 reference zircon (Jochum et al., 2011) and the Plešovice reference zircon (Black et al., 2003), both of which were treated as unknowns. The Temora reference zircon had a measured age of 415.2 ± 2.4 Ma (95% confidence, mean square weighted deviation = 0.40, probability = 0.98) and a published age of 416.8 ± 1.1 Ma by thermal ionization mass spectrometry (TIMS) (Jochum et al., 2011). The Plešovice reference zircon had a measured age of 337.7 ± 2.0 Ma (95% confidence, mean square weighted deviation = 0.36, probability = 0.91) and a published TIMS age of 337.1 ± 0.4 Ma (Sláma et al., 2008).
Trace element abundances measured in the zircon 91500 (calibrated with NIST 610) were within the range of reported values from the GeoReM database. Uranium-lead isotopic data were corrected for common lead using the model lead composition of Stacey and Kramers (1975). Chondrite normalization was applied using the values from Sun and McDonough (1989) for trace element analyses and data handling.
Tera-Wasserburg concordia plots of 238U/206Pb versus 207Pb/206Pb were generated using an in-house application designed by CODES. The Tera-Wasserburg concordia plot is a graphical method used in uranium-lead geochronology to interpret isotopic data, particularly for the mineral zircon. It was introduced by F. Tera and G.J. Wasserburg in 1972 as a more precise way to display and correct radiogenic lead loss in uranium-lead isotopic systems. This app was written in R, utilizing IsoplotR software (Vermeesch, 2018). Since the analyzed ages obtained from all 10 laser spots were <1.5 Ga, 206Pb/238Pb ages are reported, with no 207Pb correlation age.
RESULTS
Gemological Properties. The samples ranged from light blue to blue to violet blue. They had an RI of 1.760–1.768 (birefringence 0.008) and SG values ranging from 3.99 to 4.10. Nearly all the samples were inert to both long- and short-wave UV radiation because of their high iron trace element content (again, see table 1). Most showed distinct pleochroism under a dichroscope, though pleochroism was very weak and indistinct in some cases.
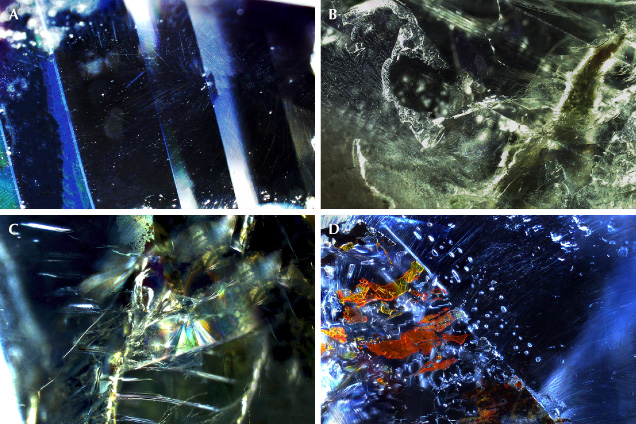
Internal Features. Microscopic observation revealed that the Baw Mar samples shared many of the inclusions seen in “classic” Mogok blue sapphires (Themelis, 2008; Giuliani et al., 2014; Hughes et al., 2017). Under magnification, the samples frequently showed multiple twin planes, usually observed oblique to the sample surfaces (figure 7A). Whitish epigenetic boehmite imprints were found along with many fractures (figure 7B). Tabular negative crystals surrounded by iridescent thin films were often observed (figure 7C). Some of the healed fissures were filled with orange iron oxide fragments and showed unusual colors along the fractures (figure 7D).
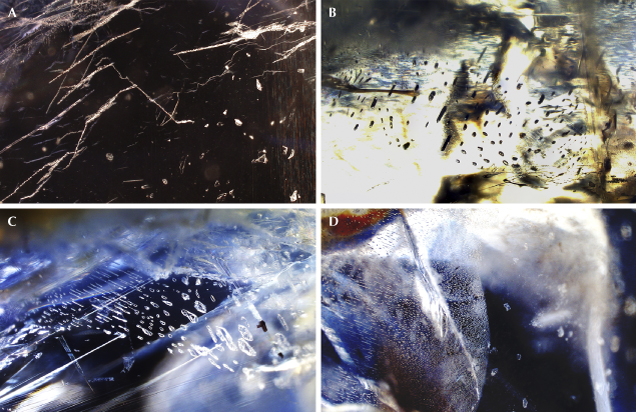
Most of the samples contained colorless, distinct negative crystals, and some exhibited arrays of whitish stringers (figure 8A). Two-phase fluid and multi-phase inclusions were also abundant (visible with oblique illumination) and could be mistaken for solid inclusions (figure 8, B and C). Fluid fingerprints, which are common in sapphires from the Mogok Stone Tract, were found in many samples (figure 8D).
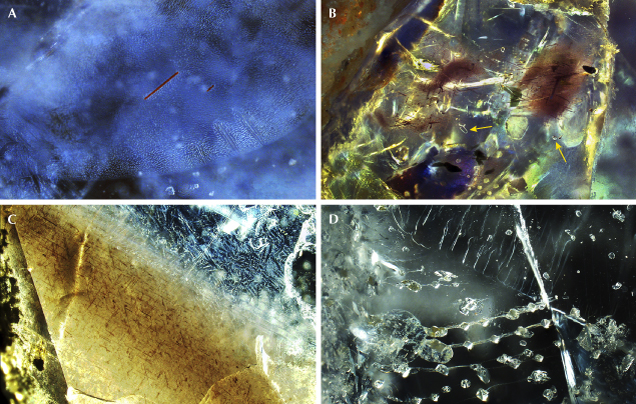
Several types of solid inclusions were seen in the Baw Mar blue sapphires. The most common of these were zircon, unidentified opaque black crystals, feldspar, and mica. Reddish brown short needles (probably rutile) were frequently observed with large fluid fingerprints (figure 9A). Transparent, irregularly shaped, and colorless crystals of feldspar were commonly associated with both parallel brownish and dark green micas (magnesium biotite). Some tabular negative crystals were associated with clouds of platy brown mica (figure 9B). Also observed were three-directional sets of short, silk-like ilmenite needles (figure 9C). Transparent colorless crystals of zircon appeared as either single crystals or in clusters, usually with fingerprints or tension fractures (figure 9D).
Raman Spectroscopy. The Baw Mar samples displayed Raman shifts consistent with those of sapphires from across the Mogok region. This suggests that Raman spectroscopy has a limited role in determining the specific origin of Burmese sapphires.
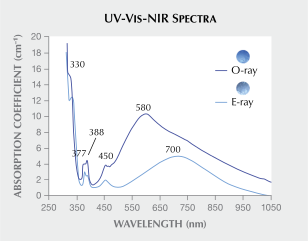
UV-Vis-NIR Spectroscopy. UV-Vis-NIR spectra were very similar across the entire set of samples. Example UV-Vis-NIR spectra from sample BMS-014 (figure 10) exhibited prominent Fe3+ absorption features, with a significant shoulder at 330 nm and distinct peaks at 377, 388, and 450 nm. Notably, the peak at 388 nm is higher than the 377 nm peak in the o-ray, while the opposite is observed in the e-ray. Additionally, a broad band centered at 580 nm in the o-ray and at 700 nm in the e-ray can be attributed to Fe2+-Ti4+ intervalence charge transfer. Moreover, the o-ray spectrum displays a weak broadband at about 870 nm, associated with Fe2+/Fe3+ clusters (Kan-Nyunt et al., 2013). Unlike other classic Mogok sapphires, the Baw Mar samples display high Fe3+ absorption peaks in the violet and blue regions, and most also show an intense shoulder near 340 nm. The intensity of the Fe2+/Fe3+ bands in the near-infrared region varies significantly and can sometimes be mistaken for the spectra of basaltic sapphires (Kan-Nyunt et al., 2013).
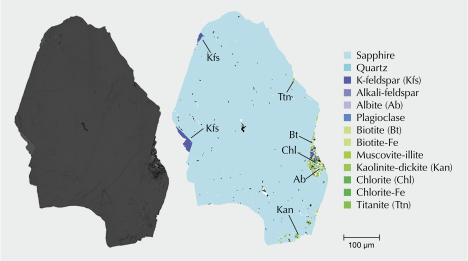
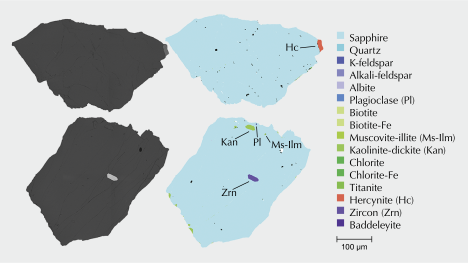
SEM-EDS. SEM-EDS automated mineralogical analyses identified molybdenite, chlorite, baddeleyite, hercynite, and pyrite as associated minerals. The BSE images and mineral maps are shown in figures 11 and 12.
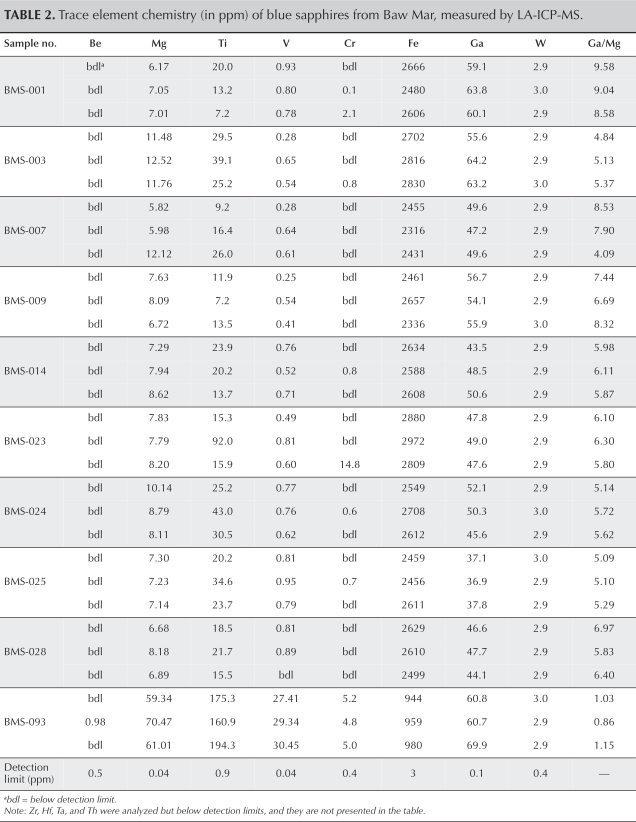
LA-ICP-MS. The results of LA-ICP-MS trace element analyses for 10 blue sapphires from Baw Mar are summarized in table 2. Sample BMS-093 had distinctly different trace element ranges than the other nine samples, and therefore this sample has been excluded when discussing ranges. All of them exhibited relatively high iron contents, ranging from 944 to 2880 ppm. Magnesium content in most samples was low, ranging from 5.8 to 12.5 ppm, while gallium concentrations were moderate at 36.9 to 64.2 ppm. Vanadium concentrations were generally low, with values ranging from below the detection limit (bdl) to 0.95 ppm. Titanium varied from low to moderate levels of 7.2 to 92.0 ppm. Chromium levels were predominantly below the detection limit. Trace amounts of tungsten were detected in most of the samples but were insignificant. Other high field strength elements (including zircon, niobium, tin, hafnium, tantalum, and thorium) were in most cases either below detection limits or only slightly above.
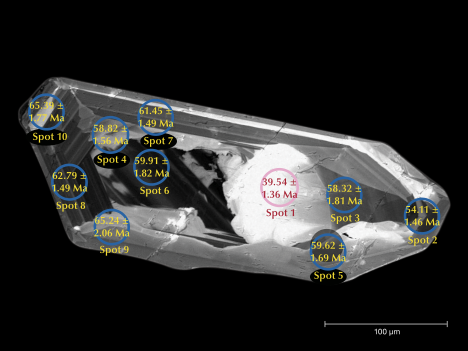
Geochronological Data of a Zircon Inclusion. Ten laser ablation spots were analyzed to measure the uranium and lead isotope ratios and the trace element content of the zircon inclusion in sample BMS-019, focusing on the zoning from the rim to the bright core observed by CL imaging. The zircon inclusion’s morphology revealed a euhedral prismatic shape with smooth outlines. CL imaging displayed well-defined growth structures (figure 13), allowing the identification of two distinct age groups. The older age group is characterized by concentric zircon rims with overgrown, optically disrupted younger zircon layers. These zircon cores exhibit short prismatic shapes, with dimensions typically ranging from 20 to 27 μm. Fine oscillatory zoning, which represents the youngest growth phase of the inclusion, is often altered and replaced by irregular, dark to bright patches or indistinct gray areas within the zircon structure.
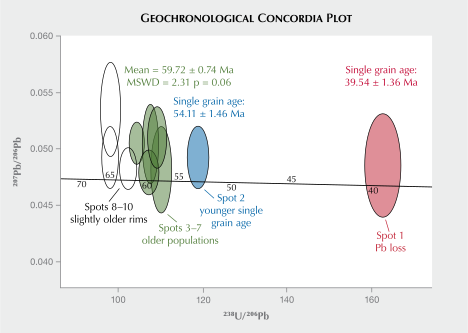
The oldest age, corresponding to the rim analyses from spots 2 to 10, ranges between 54.1 ± 1.6 Ma and 65.4 ± 1.8 Ma. The youngest age was obtained from spot 1, a CL-bright interior domain of the zircon inclusion, yielding a concordia age of 39.54 ± 1.36 Ma (figure 14). Among all analyzed spots, spot 1 shows the lowest total lead concentration. While its overall pattern is consistent with the other zircon spots, the lower absolute lead abundance and its anomalous young age may reflect a metamorphic/metasomatic overprint event resulting in potential lead loss, or partial metamictization, as suggested by Xu et al. (2012). For a summary of the zircon inclusion’s uranium-lead dating results, see supplementary table S1.
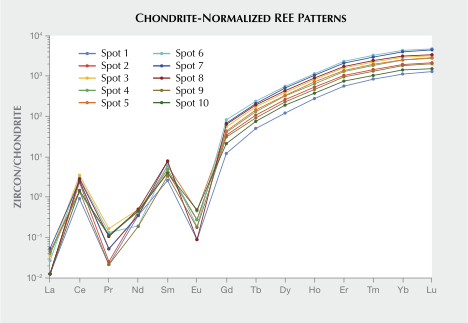
Chondrite-normalized rare earth element (REE) concentrations of the 10 spots are presented in supplementary table S2, and the corresponding spider plot is shown in figure 15.
The 10 spots from the zircon inclusion display a steep positive slope from light to heavy REEs, with strong enrichment of heavy REEs and significant depletion in light REEs. These patterns are consistent with zircon crystallization from a silicate melt, as zircon preferentially incorporates heavy REEs due to their smaller ionic radii and higher charge compatibility into the zircon lattice structure (Hoskin and Schaltegger, 2003). A positive cerium anomaly and a negative europium anomaly are pronounced in all sampled spots. The positive cerium anomaly results from the oxidation of Ce3+ to Ce4+ under oxidizing magmatic conditions, which enhances its compatibility in zircon compared to trivalent REEs. The negative europium anomaly indicates plagioclase fractionation during magma evolution, where Eu2+ is removed preferentially, leaving the melt, and subsequently the zircon, depleted in europium (e.g., Belousova et al., 2002; Sutthirat et al., 2020).
The uniformity in spider plot shapes across all spots suggests a common magmatic origin and supports the interpretation that these zircons crystallized from a syenite to syenite-pegmatitic melt. This is consistent with field observations of pegmatitic textures and their close genetic association with the formation of blue sapphire in Baw Mar.
Thus, the REE distribution and chondrite-normalized REE patterns provide strong evidence for a magmatic origin of the zircon inclusion, consistent with high-temperature crystallization and preservation of its primary geochemical signature.
DISCUSSION
Origin of Baw Mar Sapphire. It is widely accepted that sapphire deposits are formed through metasomatic, metamorphic, or magmatic processes. In small-scale metasomatism, desilication reactions occur primarily between silico-aluminous rocks (e.g., pegmatites and gneisses) and silica-poor rocks (e.g., ultramafic rocks and metacarbonates). These reactions result in the formation of sizable sapphire deposits (Sutherland and Coenraads, 1996; Simonet et al., 2008; Sutherland and Abduriyim, 2009; Sutherland et al., 2009, 2015; Giuliani et al., 2014; Harris et al., 2017; Wong et al., 2017; Sutherland and Zaw, 2020).
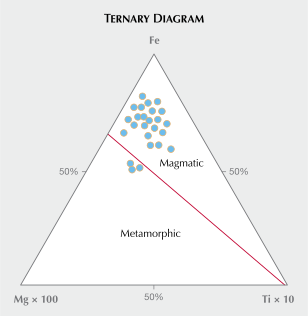
The iron-magnesium-titanium ternary diagram proposed by Peucat et al. (2007) shows that most Baw Mar sapphires, including those with moderately high magnesium contents, plot consistently within the magmatic field. The exception is sample BMS-093, which lies near the edge of the magmatic domain (figure 16). The gallium-to-magnesium ratios, ranging from approximately 6 to 10, are broadly consistent with sapphires formed from alkaline magmas (Sutherland et al., 2009; Giuliani et al., 2014; Palke et al., 2019) such as syenites or alkali basalts.
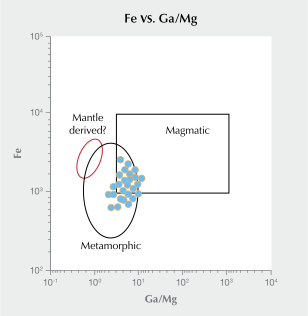
Initially, a few samples that plot near or slightly within the metamorphic field on the iron versus gallium-to-magnesium ratio diagram (figure 17) were thought to reflect a later tectono-metamorphic overprint. However, upon further evaluation, the authors found no mineralogical, inclusion-based, or textural evidence (e.g., growth zoning, recrystallization textures, or associated metamorphic minerals) to support this hypothesis. Instead, the trace element variations appear to result from magmatic heterogeneity, possibly related to melt evolution, fractional crystallization, or minor interaction with metasomatic fluids within the intrusive host rocks.
This interpretation is supported by recent work by Belley et al. (2025), which demonstrated that trace element fields for magmatic sapphires can overlap with those traditionally considered metamorphic, especially when corundum crystallizes from partially molten systems. The findings from that study challenge the sharp dichotomy between magmatic and metamorphic geochemical fields, arguing for a more nuanced understanding, particularly in alkali-rich, low-silica systems, where corundum stability is sensitive to small compositional shifts. Therefore, the observed geochemical signatures in Baw Mar sapphire are best explained by formation in a magmatic system, likely linked to syenitic pegmatite intrusions, with internal chemical variability rather than metamorphic overprinting. This conclusion is consistent with field geology and previous studies that identify Baw Mar as a magmatic-related sapphire deposit (Kan-Nyunt et al., 2013; Soonthorntantikul et al., 2017).
Microscopic observations of blue sapphires from Baw Mar revealed a broad range of internal features, many of which are consistent with those found in classic Mogok sapphires mined elsewhere within the region. However, several notable differences suggest distinct geological conditions during crystal growth and post-crystallization history.
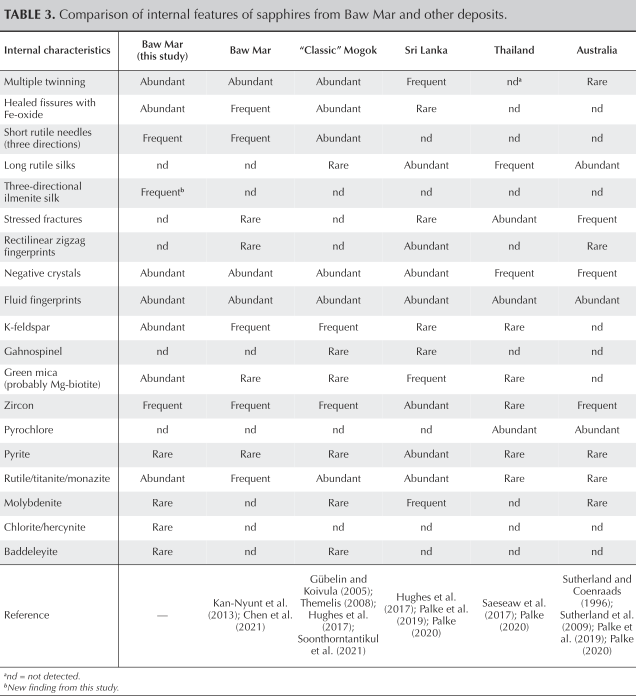
Multiple oblique twinning planes are prominent in Baw Mar sapphire. Such twinning planes are similar to those described in classic Mogok and Sri Lankan sapphires, but generally absent in Thai and Australian samples (Hughes et al., 2017; Soonthorntantikul et al., 2021). Healed fissures filled with iron oxide fragments, likely resulting from alteration of sulfide inclusions, are common in Baw Mar sapphire and occasionally found in classic Mogok and Sri Lankan sapphires, but rarely reported in samples from Thailand and Australia, as summarized in table 3 (Ferguson and Fielding, 1971; Hughes and Win, 1995; Abduriyim and Kitawaki, 2006; Themelis, 2008; Chitty, 2009; Zwaan et al., 2015; Saeseaw et al., 2017; Palke, 2020; Soonthorntantikul et al., 2021).
A critical observation from this study of sapphires from Baw Mar is the presence of needle-like inclusions aligned in three crystallographic directions (again, see figure 9C). These inclusions are morphologically similar to classic rutile silk, which is well documented in sapphires from Mogok, Sri Lanka, and Australia (Giuliani et al., 2014; Hughes et al., 2017; Saeseaw et al., 2017; Soonthorntantikul et al., 2017). However, Raman spectroscopy confirmed that these fine needle-like inclusions forming silk patterns in several Baw Mar sapphires are composed of ilmenite, not rutile. The ilmenite needles are arranged in three distinct crystallographic directions, resembling traditional rutile silk but representing a novel ilmenite-based silk morphology. This structural alignment was observed in ~60% of the highly included samples in this study. Short needle-like ilmenite has previously been described as particles or platelets (Soonthorntantikul et al., 2017). However, three-directional ilmenite needles have not been previously reported as ilmenite silk in either Baw Mar or other Mogok sapphires. The authors therefore propose the term three-directional ilmenite silk, which may indicate a unique crystallization environment or exsolution mechanism distinct from other sapphire localities (Kan-Nyunt et al., 2013; Soonthorntantikul et al., 2017; Palke et al., 2019; Chen et al., 2021).
Other inclusion types observed in Baw Mar sapphire—short rutile needles, fluid fingerprints, negative crystals, and multi-phase fluid inclusions—are common features in Mogok and Sri Lankan sapphires. Long rutile silk, which is abundant in Sri Lankan and Australian sapphires, was absent in the Baw Mar samples. Solid inclusions such as zircon, feldspar, biotite, fuchsite, and occasionally molybdenite, chlorite, baddeleyite, hercynite, and pyrite—identified only by SEM-AMICS and assumed to be associated mineral inclusions—further support an igneous or metasomatic origin, consistent with field evidence indicating a pegmatitic or syenitic host rock for Baw Mar sapphire.
The absence of gahnospinel, a common inclusion in Mogok and Sri Lankan stones, and the presence of rare mineral inclusions in Baw Mar specimens highlight the geological uniqueness of this deposit. These micro-features, particularly the three-directional ilmenite silk, may offer an important microanalytical fingerprint for origin determination and advance our understanding of sapphire formation in pegmatitic-syenite-related geological settings.
Timing of Baw Mar Sapphire Formation. The formation of rubies in the Mogok area is believed to have occurred between approximately 32 and 17 Ma, likely linked to high-grade regional metamorphism. Uranium-lead dating of titanite inclusions in Mogok ruby yielded ages of 31–32 Ma, corresponding to the Oligocene (Link, 2016; Zaw et al., 2017). Similarly, secondary ion mass spectrometry (SIMS) uranium-lead dating of titanite from the host marble provided ages of 25.15 ± 0.24 Ma and 25.06 ± 0.22 Ma (Zhang et al., 2021). At the Le Oo mine, uranium-lead titanite ages from ruby-bearing marbles and meta-skarns were determined to be 21 Ma (Searle et al., 2020). Furthermore, uranium-lead ages of zircon inclusions in gem-quality ruby and spinel were found to be 22.26 ± 0.36 Ma and 22.88 ± 0.72 Ma, respectively, while zirconolite yielded uranium-lead ages ranging from approximately 35 Ma to 17 Ma (Phyo et al., 2020).
In contrast, the timing of sapphire formation in the Mogok region remains less constrained. Searle et al. (2020) reported a wide age range from Jurassic (170–168 Ma), the late Cretaceous to early Paleocene (~68–63 Ma), and late Eocene–Oligocene (44–21 Ma) for syenite intrusions in the Mogok area. Min (2016) determined a uranium-lead zircon age of 57.81 ± 0.5 Ma (Lower Paleocene) for the sapphire-bearing nepheline syenite in the Ondan area, 40 km west of the Mogok area. Shi et al. (2021) concluded SIMS uranium-lead dating of acicular rutile inclusions in sapphire at 13.43 ± 0.92 Ma, and furnace step-heating 40Ar/39Ar dating of moonstone (antiperthite) in syenites from the MMB yielded ages of 13.43 ± 0.92 and 13.55 ± 0.08 Ma. The rutile ages seem to reflect the remobilization of titanium during metamorphism rather than the actual timing of Mogok sapphire formation. Link (2016) reported a uranium-lead age of 26–27 Ma, while Elmaleh et al. (2019) documented a uranium-lead age of 67 Ma for zircon inclusions in Mogok sapphires. However, neither study includes sufficiently detailed information on sample provenance, geographic coordinates, or spatial distribution in contrast to this research. In this study, uranium-lead isotopic data from the zircon inclusion in Baw Mar sapphire BMS-019 also revealed an unexpected reverse age zoning sequence. The core (spot 1) recorded the youngest age of 39.54 ± 1.36 Ma, while the other spots yielded older ages (54–65 Ma). In a simple magmatic setting, one would observe the oldest ages at the core, reflecting outward growth of zircon during melt crystallization.
One well-documented mechanism for a reverse age zoning sequence is the selective loss of lead from metamict cores via hydrothermal fluids. These metamict zones in zircon, which are amorphous or highly disordered, are caused primarily by radiation damage from high concentrations of naturally incorporated uranium and thorium within the crystal structure. Over time, alpha decay of these radioactive elements causes cumulative damage to the zircon crystal lattice, leading to the development of a perforated internal structure and microcracks and creating pathways for rapid fluid ingress (Xu et al., 2012) (again, see figure 17).
Radiogenic Pb4+ in these damaged sites is reduced to Pb2+ by reducing fluids and is leached out (Geisler et al., 2001; Xu et al., 2012). Comparing the total lead concentrations (in ppm) of spot 1 and spots 2–10 shows a suspiciously young 206Pb/238U age in the core, while less altered rims preserve the actual crystallization age.
In sodalite syenite from Ejinao, the type locality in south China (Xu et al., 2012), cores were found to be up to ~5 Ma younger than the rims, directly attributed to fluid-induced lead depletion. By analogy, the 39.5 Ma age in BMS-019’s core likely reflects hydrothermal overprinting rather than a genuine late crystallization event.
Therefore, the range of ages from the nine spots not in the center of the zircon is interpreted as representing the primary magmatic crystallization interval for this tested zircon (and by extension, the host sapphire) during the Baw Mar syenitic pegmatite formation.
An alternative but not mutually exclusive explanation is secondary zircon recrystallization, whereby a younger zircon growth phase infills along cracks or replaces older cores during a later thermal or metasomatic (hydrothermal) pulse (Rubatto, 2002; Geisler et al., 2007). However, the bright patch (or bright phase) in the zircon grain with a 40 Ma age determination has a homogeneous texture (spot 1) and is therefore consistent with later metamorphic/metasomatic overprint (again, see figures 13 and 14).
Hence, the pronounced reversal of age zoning and the known fluid-rich environment strongly favor a lead-loss model. Therefore, the authors propose that the ages ranging from 54.1 ± 1.6 Ma to 65.4 ± 1.8 Ma, observed in the neatly zoned regions of the zircon, represent the actual timing of sapphire formation in the Baw Mar area.
CONCLUSIONS
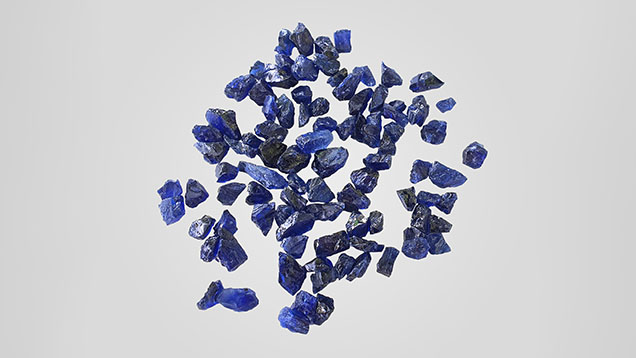
The Baw Mar area is located in the high-grade Mogok Metamorphic Belt, which hosts numerous primary and secondary ruby and sapphire deposits, along with those of several other gems. The sapphires at Baw Mar are hosted in syenitic pegmatite that intruded the Proterozoic metamorphic rock sequence. The sapphire sizes range from 2 to 8 mm, with some reaching up to 15 cm (figure 18). Most of the Baw Mar sapphires exhibited internal characteristics that are largely consistent with those documented in previous studies of sapphires from other Mogok origins.
The most common syngenetic inclusions found in the studied Baw Mar sapphires were fluid fingerprints, as well as two-phase fluid and multi-phase inclusions. Epigenetic inclusions typically manifested as boehmite and iron oxide imprints in healed fissures. Furthermore, colorless potassium-feldspar, brownish biotite mica, greenish mica, zircon, rutile, apatite, and ilmenite were observed as protogenetic mineral inclusions, identifiable with microscopy and Raman spectroscopy. An important feature observed in the samples consisted of three-directional ilmenite silk, which may offer a microanalytical fingerprint for origin determination and advance the knowledge of sapphire formation in pegmatitic-syenite-related geological settings. According to SEM-AMICS data analysis, biotite, magnesium biotite, chlorite, iron hydroxide, hercynite, pyrite, baddeleyite, and rutile were observed as associated minerals.
Uranium-lead dating ranging from 54.11 ± 1.6 Ma to 65.39 ± 1.77 Ma, observed in the well-defined zoning of the zircon inclusion in sample BMS-019, are interpreted as representing the timing of sapphire formation in Baw Mar. The trace element variations of the studied Baw Maw sapphires appear to result from magmatic processes, possibly related to melt evolution, fractional crystallization, or minor interaction with metasomatic fluids within the intrusive host rocks. Ongoing petrogenetic, geochemical, and geochronological investigations of sapphire-related syenitic pegmatite intrusions in the Baw Mar area will provide valuable new insights into the magmatic and metamorphic evolution of the Mogok Metamorphic Belt.
Arkar Moe Myint received a master’s degree in geology from Chulalongkorn University in Bangkok and is currently a PhD student at the School of Earth and Environmental Sciences (SEES), Seoul National University, Korea. Dr. Pitsanupong Kanjanapayont is a professor of geology and deputy dean of the Faculty of Science, and Dr. Abhisit Salam is a retired lecturer from the Department of Geology, at Chulalongkorn University. Dr. Khin Zaw is a professor of economic geology at the School of Natural Sciences, Centre of Ore Deposit and Earth Sciences (CODES), Dr. Karsten Goemann is a senior research fellow at the Central Science Laboratory, and Dr. Jeffrey Oalmann is a manager of the CODES Analytical Laboratory, at the University of Tasmania in Sandy Bay, Australia. Dr. Bhuwadol Wanthanachaisaeng is chief of research and standard development at the Gem and Jewelry Institute of Thailand in Bangkok.
Arkar Moe Myint received a master’s degree in geology from Chulalongkorn University in Bangkok and is currently a PhD student at the School of Earth and Environmental Sciences (SEES), Seoul National University, Korea. Dr. Pitsanupong Kanjanapayont is a professor of geology and deputy dean of the Faculty of Science, and Dr. Abhisit Salam is a retired lecturer from the Department of Geology, at Chulalongkorn University. Dr. Khin Zaw is a professor of economic geology at the School of Natural Sciences, Centre of Ore Deposit and Earth Sciences (CODES), Dr. Karsten Goemann is a senior research fellow at the Central Science Laboratory, and Dr. Jeffrey Oalmann is a manager of the CODES Analytical Laboratory, at the University of Tasmania in Sandy Bay, Australia. Dr. Bhuwadol Wanthanachaisaeng is chief of research and standard development at the Gem and Jewelry Institute of Thailand in Bangkok.